
In many European countries, the network operator publishes (near) real time information on the electricity production and the contribution of renewable energy .
Germany
In Germany, every day EEX publishes the expected power production of wind power , solar power and conventional power plants . Every hour, the actual production is updated (with a few hours delay) .

Agora-Energiewende publishes comparable data including power production from biomass and hydropower.

Solar-pv inverter producer SMA has a nice website that shows an estimate of the real time solar power production in Germany.

Agora Energiewende publishes the composition of the conventional power production from the previous day by fuel (nuclear, hard coal, lignite, gas, etc. )

And last but not least: Fraunhofer has a website where all of this information can be accessed and turned into several excellent charts

Denmark
The Danish operator of the national electricity (and gas) grid Energinet.dk publishes real time data of the power production from wind energy, solar, cogeneration (heat&power) and conventional power plants in a nice animation. The data are available in raw form as well.
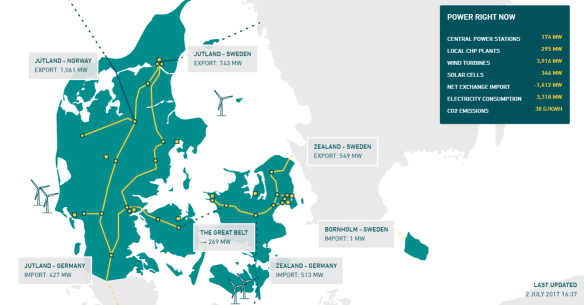
The software and consultancy company EMD uses the same data for their website where you can get an overview of the power production mix, power prices and import and export. thanks to @PaulNeau for the reference]

Scandinavia
For the Scandinavian countries Sweden, Norway, Finland, Denmark and Estonia, real time data are published on the power production mix (click ‘table’ below the map) and the import and export of electricity.

For a number of countries in the Scandinavian Nordpol region, a prognosis of the wind power production for the next day is published as well.

Belgium
National Belgium grid operator Elia publishes the prognosis and real time data on the wind and solar power production. For wind energy separate data are available for onshore and offshore wind turbines.

Elia also publishes the expected power mix for the next day. I have the impression that this does not include solar power and only a part of the wind energy capacity.

United Kingdom
In the UK, a wealth of data on power production is published on the dedicated BMRS website. The graphs on this page are rather slow and user unfriendly, but apparently the data can be imported to other websites. Several enthusiasts use these BMRS data for their own website on real time power production like Gridwatch en this beautiful one by Stephen Morley.

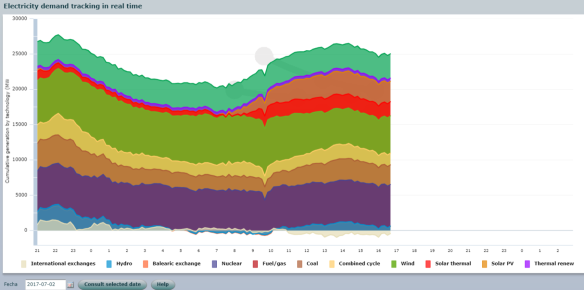
Spain
In Spain, the national grid operator REE publishes a lot of information on the real time power production on their website. The one I like best is the graph which shows how the power production mix changes throughout the day. REE publishes this in English as well as Spanish.
France
For France, grid operator RTE has a very nice tool on their website (in English..) showing the real time power production by source (nuclear, coal, gas, hydro, wind, solar, etc.). [thanks to @PaulNeau and ‘Snoop’ (below in the comments) for the reference]

RTE also publishes the forecasted production for power from wind energy and from solar power.
Gridwatch presents the RTE data in a dashboard. [Thanks to @RobVuurvlieg for the link]

Ireland
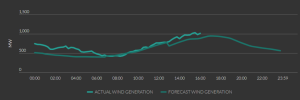
The Irish grid operator Eirgrid publishes the forecast day-ahead and actual production of wind energy.
Eirgrid also publishes an overview of the power production by source.

Austria
Austrian grid operator APG publishes an overview of the actual power production by source (incl. wind, solar, biomass etc.).

APG also publishes a forecast of the wind and solar power production for the next day.

Bulgaria
The Bulgarian national grid operator publishes real time data on the power production mix in Bulgaria on their website. The text is in Bulgarian. I have not yet found the information on the English version of the website. [Thanks to Dimitar Mirchev for the link]

Romania
The Romanian grid operator Transelectrica publishes real time data on the power production mix. The website also has a view where the production from all different sources is shown for any chosen period of time.

Portugal
Power production mix incuding contribution of renewable energy sources (data published with a 2-3 day delay) )

Italy
http://www.terna.it/default/Home/SISTEMA_ELETTRICO/transparency_report.aspx
Wind and solar [it seems these data are only published in spreadsheets with long tables] http://www.terna.it/default/Home/SISTEMA_ELETTRICO/transparency_report/Generation/Forecast_generation_wind.aspx
California
Power production mix of the previous day.

Australia
Real time power production mix for 6 states in Australia.

The Netherlands
For information on the Netherlands, see this blog (in Dutch).
Wind energy
Association Wind Europe has a tool on its website which gives an estimate of the wind power production the previous day for most European countries.

Production mix by country
This website has a nice map with an estimate of the actual CO2 emission per kWh electricity produced by country in Europe. The estimate is based on the production mix for each country. The website uses data from ENTSO-E (unfortunately, ENTSO-E does not have reliable data for the Netherlands).

The website has an overview with websites with information on actual power production by country (ENTSO-E is the source used for most countries).
Do you know more real time data on renewable power production by country? Please let me know!

Hello there!
Very nice article with LOTS of excellent links! Just wanted to add one for France that is a bit more user friendly:
http://www.rte-france.com/en/sustainable-development/eco2mix
From there you get into the production section:
http://www.rte-france.com/en/sustainable-development/eco2mix/national-data/power-generation-by-energy-source
Keep up the good work!
Snoop
SEE ENERGY IN NEW ZEALAND http://www.med.govt.nz/sectors-industries/energy/energy-modelling/publications/energy-in-new-zealand-2013
You can add this sites for Bulgaria:
real tiem data from our TSO:
http://tso.bg/default.aspx/page-707/bg
Thanks Dimitar!
Could you give a translation of the main energy sources?
(I only know a few words in Bulgarian…)
Pingback: Hoeveel duurzame energie wordt er vandaag geproduceerd in Duitsland, Denemarken, Groot-Brittannië, Spanje, Portugal, Italië, Ierland, Bulgarije, Roemenië en Nederland? | jaspervis
The French dashboard has now moved to http://www.rte-france.com/en/eco2mix/eco2mix-mix-energetique-en
Thanks!
Hello Jasper,
Really nice links!! Do you know any of them from China and USA?
Hi Rainier,
Thanks! There definitely is info for the USA, mainly on a state level. I didn’t add those yet.
Real time electricity info available in India – States like Maharastra, Gujarat, Madhya Pradesh publish real time.. http://www.wrldc.com/onlinestate.aspx
Hi there,
Entsoe-E went online with its new transparency plattform on 5th of january. You will find plenty of data there (including Netherlands 😉 )
Cheers,
Christoph
Hello , that is good work , supplying those links !!! And helps a lot to understand Europe in relation to essentials , better ,
Fraunhofer institude in Germany , now have a good site as well … https://www.energy-charts.de/power.htm
thanks Billi
Oh , just saw ,, hou have that linked allready …
Thanks
I guess its time to link Europe better , with renewables …
Midcontinent Independent Systems Operator (mid-USA) https://www.misoenergy.org/MarketsOperations/RealTimeMarketData/Pages/FuelMix.aspx and Ontario Canada http://www.ieso.ca or http://live.gridwatch.ca/home-page.html
Hi there
We’re progressively aggregating all of these feeds together in the internationally-focused LiveGen(tm) widget:
http://data.reneweconomy.com/LiveGen
We’ll sort through the suggestions above to see what we are missing (I see at least a few, many thanks) but please let us know if there are others:
LiveGen@global-roam.com
Thanks
Paul
Great overview Jasper!
I now there are several related initiatives going on in NL (some of them I am involved myself).
For example the ‘Nationale Energie Atlas’ (first release planned for go-live 2016Q4).
RWS is also collecting lot of interesting data, you might take a look at http://www.lokaleenergieetalage.nl/kennisportaal.
And there is some interesting info at http://www.energiekaart.net and http://www.hieropgewekt.nl.
And you might also take a look on http://www.atlasleefomgeving.nl/
Hope this helps!
Awesome work! This has been a very good resource for me when creating the Electricity Map (http://www.electricitymap.org). Thank you for regrouping those resources together!
Also, if anyone wants to help me visualise this for the whole world, please send me an email at hello@tmrow.co!
Olivier